The kurtosis of a normal distribution is an important statistical concept, often discussed in relation to the shape of data distributions. Kurtosis refers to the "tailedness" or the extremity of data points in a given dataset. The kurtosis of a normal distribution is 3, which acts as a baseline or reference for comparing other distributions. Understanding why this value is set at 3 can help in assessing how data behaves, particularly when considering whether data has heavy or light tails. In this article, we will delve into the reasons behind the kurtosis of the normal distribution and its significance in statistical analysis.
What Is Kurtosis?
Kurtosis is a measure of the "tailedness" or the sharpness of a data distribution. It reflects the presence of outliers or extreme values in the dataset. A normal distribution, known for its bell-shaped curve, has a kurtosis value of 3, which means it has a moderate concentration of values near the mean, with fewer extreme data points. The kurtosis value helps in determining whether the distribution has more extreme outliers than a normal distribution or fewer. A distribution with a kurtosis higher than 3 is considered leptokurtic, while a distribution with a lower kurtosis is platykurtic.
Kurtosis and Normal Distribution
In the case of a normal distribution, the kurtosis value is set at 3 because it describes a balanced spread of data with moderate tails. This value serves as a reference point for understanding how other distributions compare. When a distribution has a kurtosis of 3, it indicates that it follows the properties of a normal distribution, where the tails are neither too heavy nor too light. A value of 3 is also significant because it provides a baseline for detecting deviations in the shape of distributions in various datasets. Understanding this baseline kurtosis is essential when comparing data to see if it is normally distributed or if it shows signs of skewed or extreme values.
Excess Kurtosis
While the kurtosis of a normal distribution is 3, many statistical analyses focus on what is called "excess kurtosis." Excess kurtosis is calculated by subtracting 3 from the kurtosis value, effectively setting the kurtosis of a normal distribution to zero. This adjustment allows for easier comparison between distributions without constantly referencing the baseline value of 3. For instance, a distribution with excess kurtosis greater than zero is considered leptokurtic, and one with excess kurtosis less than zero is platykurtic. Excess kurtosis is especially useful in assessing the presence of outliers in a dataset.
Why Kurtosis Matters in Statistics
Kurtosis plays a crucial role in understanding the nature of data distributions. For example, high kurtosis often signals the presence of significant outliers in the dataset, which can affect the results of statistical tests. Researchers use kurtosis to determine the reliability of statistical measures such as the mean, variance, and standard deviation. If the kurtosis is too high or too low, it might suggest that the data is not normally distributed, potentially distorting summarys. By understanding kurtosis, statisticians can better evaluate the shape of data and take appropriate measures to handle extreme values.
Leptokurtic vs. Platykurtic Distributions
Distributions with a kurtosis greater than 3 are called leptokurtic, which means they have heavy tails and a sharp peak. These distributions tend to have a higher probability of extreme values or outliers. On the other hand, platykurtic distributions have kurtosis values less than 3, indicating that they have lighter tails and are less prone to extreme values. The key difference between these two types of distributions is the behavior of the tails and how likely it is for values to be far from the mean. Leptokurtic distributions often present challenges for statistical analyses because they increase the likelihood of outliers influencing results.
Vote
Who is your all-time favorite president?
The Relationship Between Kurtosis and Skewness
Kurtosis is often discussed alongside skewness, another important measure of data distribution. While kurtosis looks at the tails of the distribution, skewness measures the asymmetry or lopsidedness of the distribution. Data with high skewness might lead to misleading kurtosis values, as the presence of outliers or a tilted distribution can distort the shape of the tails. It is essential to consider both measures together when analyzing the shape of data distributions. The combination of skewness and kurtosis provides a more complete picture of how data behaves and whether it deviates from the normal distribution.
Kurtosis in Real-World Data
In real-world datasets, kurtosis is used to assess risk, especially in fields such as finance and insurance. For example, a financial portfolio with leptokurtic returns might have higher than expected risk, as the extreme values in the tails can lead to large losses. In medical data, distributions with high kurtosis could indicate the presence of rare but extreme events, such as adverse reactions to drugs. By analyzing kurtosis, researchers can better understand the likelihood of such extreme events and plan accordingly. In practice, kurtosis is an essential tool for identifying and managing the potential for extreme outcomes.
Calculating Kurtosis
Kurtosis is calculated using a mathematical formula that involves the fourth central moment of the data, divided by the square of the variance. This calculation allows statisticians to quantify how heavy the tails are relative to the normal distribution. A kurtosis value of 3 indicates that the data follows a normal distribution, while higher values indicate heavier tails and more extreme data points. In many statistical software packages, kurtosis is automatically calculated, making it easier for researchers to assess the shape of their data. Understanding the calculation process allows statisticians to make more informed decisions about data processing and analysis.
The Importance of Normal Distribution in Kurtosis
Normal distribution serves as the foundation for many statistical methods and tests, making it essential for researchers to understand kurtosis in this context. The kurtosis value of 3 provides a baseline for determining whether a dataset deviates from a normal distribution, signaling potential issues with outliers. Statistical tests like the Kolmogorov-Smirnov test rely on the assumption that data follows a normal distribution. By understanding kurtosis, researchers can evaluate whether data is suitable for such tests or if alternative methods are needed. Assessing kurtosis helps ensure the validity and reliability of statistical inferences.
Key Points About Kurtosis
- Kurtosis measures the "tailedness" of a distribution.
- The kurtosis of a normal distribution is 3.
- Excess kurtosis is the kurtosis minus 3.
- Leptokurtic distributions have higher kurtosis than 3.
- Platykurtic distributions have lower kurtosis than 3.
- High kurtosis often indicates the presence of outliers.
- Kurtosis is important for evaluating the reliability of statistical tests.
Watch Live Sports Now!
Dont miss a single moment of your favorite sports. Tune in to live matches, exclusive coverage, and expert analysis.
Start watching top-tier sports action now!
Watch NowTypes of Kurtosis
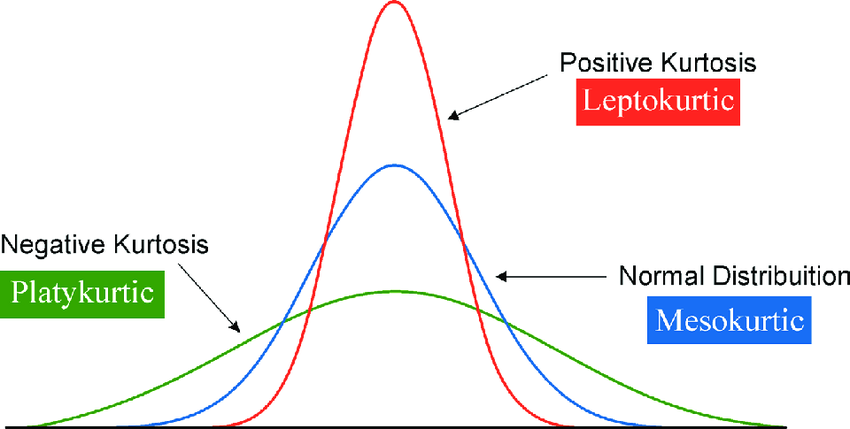
- Leptokurtic (kurtosis > 3) – Heavy tails, high peak.
- Platykurtic (kurtosis < 3) – Light tails, low peak.
- Mesokurtic (kurtosis = 3) – Normal distribution, moderate tails.
- Positive excess kurtosis – Leptokurtic distribution.
- Negative excess kurtosis – Platykurtic distribution.
- Kurtosis affects risk analysis in finance.
- Kurtosis is crucial in testing assumptions about data.
Pro Tip: When analyzing a dataset, always consider both skewness and kurtosis together. While kurtosis informs you about the tails of the distribution, skewness reveals the direction of data asymmetry. These two factors combined will give you a more accurate assessment of data behavior.
| Distribution | Kurtosis | Shape |
|---|---|---|
| Normal | 3 | Bell-shaped |
| Leptokurtic | Greater than 3 | Sharp peak, heavy tails |
| Platykurtic | Less than 3 | Flat peak, light tails |
“Kurtosis provides valuable insight into the nature of data distributions, helping researchers identify potential outliers and make better statistical decisions.”
Understanding the kurtosis of a normal distribution is essential for evaluating the behavior of data and ensuring accurate statistical analyses. If you found this article helpful, be sure to bookmark it for future reference and share it with others who may benefit from learning about kurtosis. By gaining a deeper understanding of kurtosis, you can better assess whether your data follows a normal distribution or if adjustments are needed for more accurate analyses. Don’t hesitate to explore statistical tools and software that can simplify the calculation of kurtosis in your datasets. Share this article on social media to help others grasp the importance of kurtosis in data analysis.